Recent state and federal laws in the United States have brought renewed urgency to efforts to ensure all educational content meets accessibility standards. Many universities (especially those subject to laws affecting state and local governments) now require that all material posted online, including materials inside a Learning Management System (LMS), such as Canvas or Blackboard, are accessible. While instructors have long been required to provide accommodations to students who have been officially given them by the university’s Disability Resource Center (or similar), the requirement to meet these standards in all cases is new.
While many universities are providing faculty with some support to “convert” their course materials to accessible formats, it seems like few are aware of the difficulties specific to mathematics and other STEM disciplines which rely heavily on symbolic expressions and diagrams. So it falls to us to do this work without much in the way of expert advice. While I do not claim to be an expert in this area, I will try to collect what I have learned from colleagues about what options we have. If anyone reading this has additional resources or suggestions, please get in touch.
Before we get started, let’s agree that while this is definitely additional work being added to our already overfull plates, we should welcome these requirements as an opportunity to serve all our students better. In grad school I had the opportunity to teach a student who was blind, an experience that had a tremendous positive impact on my teaching ability. No longer could I get away with saying that an increasing function is one that does “this” (gesturing wildly with my arms). Suddenly I had to engage my students with the same level of care and rigor I asked of them. Even if we didn’t care about helping all students learn mathematics, regardless of the barriers they must overcome, intentionality in our teaching practices will improve our instruction.
Measuring Accessibility
First, let’s understand what our goal is and how to decide if we have met it. Ideally, we want to make sure that our course materials are truly accessible: that they will be maximally useful to students regardless of disability. Many of the standards and tools described here attempt to verify some minimum conditions for accessibility are met; they cannot guarantee the higher standard we might desire. For example, a tool might verify that all images in a document have “alt text” so that a screen reader can describe the image to a blind reader, but there is no way to ensure that the alt text accurately or helpfully describes the image.
The primary technical standards for online documents are the Web Content Access Guidelines (WCAG) 2.1. In particular, the Federal (and it appears many state) requirements are that online content meet WCAG 2.1 Level AA guidelines. A few tools that can be used to test a website for these standards are:
For checking the accessibility of PDFs or other non-webpage documents:
- Adobe Acrobat Pro has a built in accessibility checker for pdfs. Not free, but many universities have licenses for faculty. There is a video tutorial on the Section508.gov site.
- PDFix has a variety of free online tools for fixing pdfs.
- Microsoft Office accessibility: recent versions of Microsoft Office include an accessibility checker built in.
There are lots of other commercial (but often free for limited use) tools available. For example, my university uses Canvas with the UDOIT accessibility tool to check that a Canvas course shell meets accessibility requirements.
You will quickly notice that you can scan the same webpage and be marked compliant by one tool and not by another. When a tool identifies an error, it is worth checking whether this is really something that should be fixed; we all need to prioritize the fixes that are most important from a legal and pedagogical standpoint.
Suppose you are creating a class activity or lab. It will have instructions, perhaps a worked example, and a number of prompts for students to complete. How will you create this document?
For many years, the de facto choice in mathematics has been to typeset the document in LaTeX. The source of your document is typed as a plain text file, then compiled into a beautifully typeset PDF. Unfortunately, the PDF produced does not meet accessibility guidelines. There has been some recent work to improve this, to get a “tagged” PDF as output, but this does not address issues with how symbolic expressions are embedded in the document. Try using a screen reader to listen to the contents of a LaTeX-generated PDF and you immediately hear the problem.
You could create the document in a standard word processor such as MS Word or Google Docs, although then you are at the mercy of their equation editor tools. Still, this is not an unreasonable approach, just be aware that you will need to use these tools correctly. For example, it is very tempting to create a title for a section by making the font bigger and bold. Doing so will not meet accessibility guidelines; you must mark the title as having the correct heading level and let them make the style of that heading level look like you want. But then what? Will you save the document as a PDF to post? Will the resulting PDF be accessible? You probably don’t want to post the Word document (what if your students don’t have access to Word?).
What you really want is for your document to be available as a PDF for printing and as a webpage for posting online. Webpages are much easier to check for accessibility, and much more likely to meet accessibility standards. Math can be embedded in a webpage using MathJax, which has excellent screen reader support. The disadvantage is that writing a webpage using HTML code is technically challenging, especially if you want to include math and have the result look at all good. So how can we make creating accessible webpages easier?
You could write the entire activity inside your LMS. Canvas does let you include math using the \(...\) latex syntax, and renders the math with MathJax. I think this is probably a good option for small documents, like announcements or replies to student questions. For larger documents (like our activity example), it will be difficult to create a printable version to bring to class (you probably don’t want to type up that larger document twice, once in LaTeX and once in the LMS). You also probably want to keep the activity stored somewhere else in another format in case you lose access to the LMS or your university switches to another company.
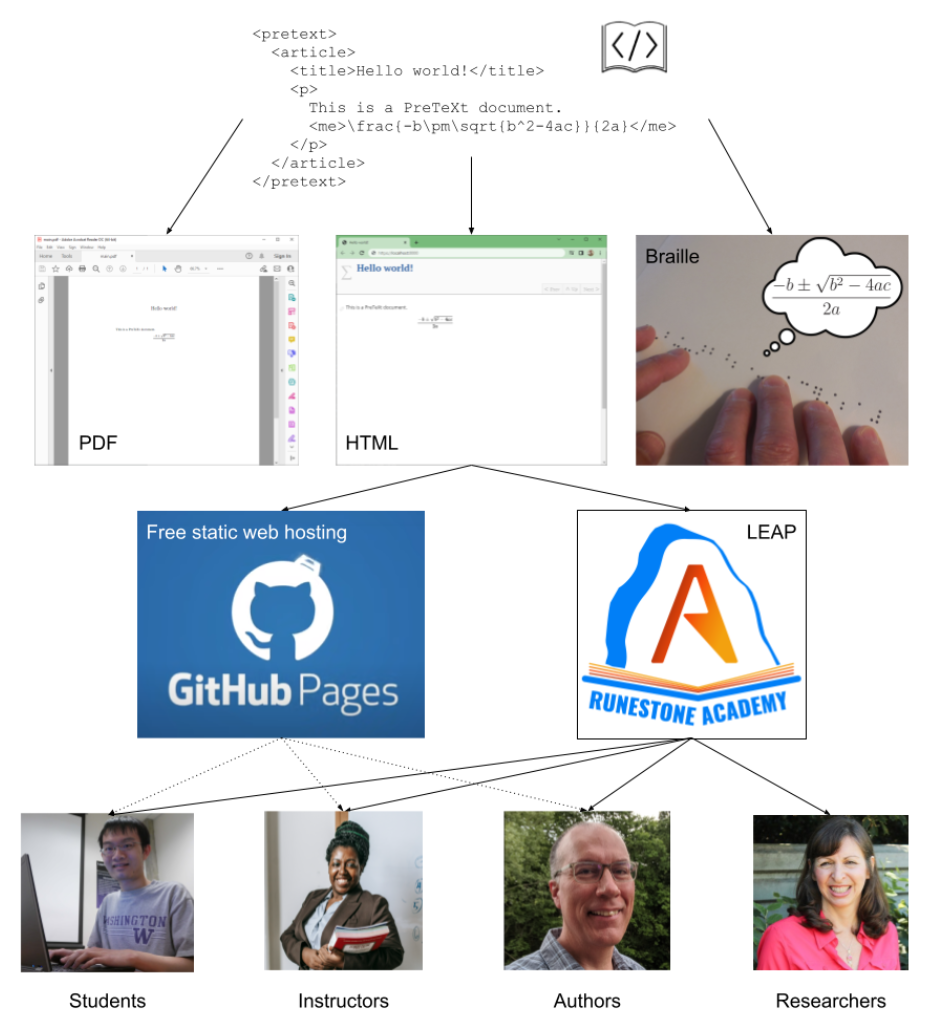
This is where tools like PreTeXt come to our rescue. We can write our documents as plain text (similar to LaTeX) then build this source into an accessible webpage for posting online and a PDF for printing. The conversion tool can take care of all the formatting (for both outputs) and we can focus on what we know, the content.
PreTeXt and Quarto
My preferred tool for authoring in mathematics is PreTeXt. Like LaTeX, you write your source file as plain text (in this case, XML) and then build your output. You can transform your source into a webpage, a PDF, epub, and even Braille files. This is all possible because the source you write uses semantic markup: you say exactly what sort of thing each part of the document is, whether it is a section, a theorem, or a term, for example. This is the key information that the processor needs to build source that can be guaranteed to be accessible.
To give you an idea of how this works in practice, here is the workflow I use to create course materials with PreTeXt:
- I have a PreTeXt project (a folder) that holds all the files for my course. I happen to use GitHub to store these files, in a private repository, so students cannot see my source files.
- To create an in-class activity, I create a new file, let’s call it
myactivity.ptx. This is a simple pretext “article” that contains a “worksheet” (the name of an element supported by PreTeXt). I write the content of the activity in that file (including specifying workspace for different “tasks” that are part of “exercises” to leave space for students to write).
- I then tell PreTeXt to build this worksheet, and it produces a PDF that I can send to the printer and bring to class. I also upload a copy of this PDF to Canvas so students can print it, or load it on a tablet to write on.
- Additionally, to ensure there is an accessible version of the document, I ask PreTeXt to build the entire course as a website and then tell it to “deploy” it. A few minutes later, the course website is updated, including the most recent activity. Where I uploaded the PDF to Canvas, I also include a link to the web version of the activity.
As an alternative to the last step, a new feature of PreTeXt allows you to create a portable HTML file. This is a single HTML file that you can upload directly to Canvas. This would be particularly useful if you wanted to share the page with just your class and not make it publicly available. Here is a short demo of how this works:
An alternative project that can also transform source files into multiple output formats, including webpages and PDF is Quarto. I am not as familiar with this tool, although it looks quite promising. It is definitely geared more to data science, and a few of the textbooks built with the system that I tested still had accessibility errors, but this might be due to issues with the source files for those particular project.
Accessible diagrams
Whatever tool you choose, there are some aspects of accessibility that will still require manual attention. Ensuring that included images and diagrams meet accessibility requirements is probably the most prominent of these.
Unfortunately, there simply is no automated way to make this happen. Even AI tools that claim to be able to write image descriptions (alt text) have no way to understand the intent of the images. Suppose you include a graph of a parabola, opening upward with its vertex at the point (2,1). That is, a graph of the parabola $y = (x-1)^2 + 2$. Okay, both of those sentences could be perfectly reasonable descriptions for the image. Which do you choose? Is the graph part of a question asking students to find the coordinates of the vertex? Is it a question asking students to find an equation for the graph?
For a more detailed discussion about writing alt text for images, check out the advice for writing image descriptions in the PreTeXt guide.
Another consideration is the quality of the images themselves. For example, avoid using just color to distinguish between elements: don’t ask students to compare the red and green curves in the graph when they might not be able to distinguish between the colors. Instead, ensure that one graph is also bold, or dashed. Try viewing your images in black and white; do they still make sense?
One final suggestion: check out PreFigure if you like creating your own diagrams. Not only is it a great way to author precise figures, the resulting graphics can be navigated with a screen reader or converted to tactile formats with labels converted to braille.
What else?
Do you have suggestions about creating accessible documents for STEM? Have a favorite tool or workflow? Comment below or get in touch. I hope to keep this guide updated with suggestions from the community.
]]>