
Creating accessible diagrams with PreFigure
As mathematicians, we often develop and express important ideas graphically, and we encourage our students to complement their technical capabilities with a more intuitive, graphical understanding. A picture’s worth a thousand words, right?
Yet creating engaging diagrams that communicate our specific ideas and including them in mathematical documents can be challenging. While readers have no doubt found a variety of ways to address this problem, here is a set of reasonable expectations we should have for any graphical authoring system:
- Free and open source, naturally
- Flexibility to create diagrams in many mathematical disciplines
- Integrates with our workflow for creating textual documents
- Ability to create the same diagram in different formats for reading, say, in print or in a browser
- Facilitates staying in our “authoring brains” so that we focus on the content we wish to express rather than technical details of how that content will be rendered
- Accessibility features that allow all readers to explore and interact with graphical content regardless of their capabilities
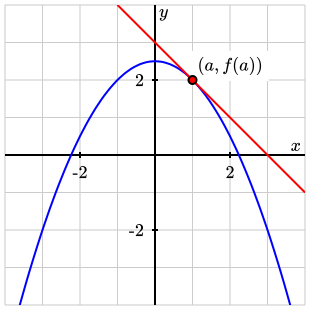
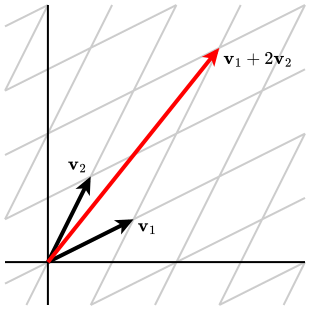
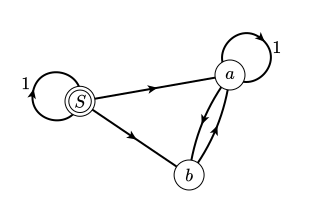
PreFigure is designed to achieve all of these goals. To create a PreFigure diagram, an author writes a description of the diagram in an intuitive markup language that reflects the mathematical meaning of the diagram. That description can then be converted into a variety of image formats, such as SVG, PDF, and PNG, suitable for use in a variety of environments. Here are some sample diagrams.

PreFigure also prioritizes diagrams that are accessible to a wide variety of readers. From the same PreFigure description used to make an SVG, an author can easily create a tactile version of the diagram, which can be explored by a visually impaired reader. Adding a set of annotations to the description allows readers to interactively explore a diagram using a screen reader. In fact, annotated diagrams provide a richer experience for all readers as they encourage more active engagement with our content.
An annotated diagram
Below is an annotated PreFigure diagram that can be explored interactively. When the focus goes to the diagram, say, by clicking in the diagram, the reader hears a high-level description of the diagram, similar to alt text. There is more, however: the set of annotations forms a tree-like structure so that, at each level, additional details can be requested using the arrow keys. The graphical components currently being explored are highlighted with a high contrast color and magnified. A visual cue, called an earcon, issued in response to an arrow press signals that no more information is available in that direction.
The source of a PreFigure diagram is an XML description of the diagram. For instance, the PreFigure source for the diagram above, without annotations, is presented here.
<diagram dimensions="(300, 300)" margins="5">
    <definition>f(x,y)=y^2 + y + x^3 + 3*x^2 - 2</definition>
    <definition>x0 = (1,1)</definition>
    <definition>del_f = 0.2*grad(f, x0)</definition>
    <coordinates bbox="(-4,-4,4,4)">
        <grid-axes/>
        <contour at="contour" function="f" value="4" stroke="blue"/>
        <vector at="gradient" v="del_f" tail="x0"/>
        <point at="x0" p="x0" alignment="sw">
            <m>x_0</m>
        </point>
        <label at="grad-label" anchor="0.5*del_f+x0" alignment="se">
            <m>\nabla f(x_0)</m>
        </label>
    </coordinates>
    <annotations>
        ...
    </annotations>
</diagram>
PreFigure syntax is meant to reflect the mathematical meaning of the graphical components that are added. For instance, one adds a contour with a contour element and a vector with a vector element. In this way, PreFigure encourages authors to concentrate on the principal ideas that the diagram is meant to convey rather than the details of how specific objects will be rendered. Mathematical labels are written in LaTeX syntax.
The values of the at attributes assigned to components serve as references to be used by the annotations, which are included in a separate section of the PreFigure source, as shown below. In addition to writing the text that will be vocalized, the author describes the relationships between various graphical components using the XML structure of the source.
    <annotations>
        <annotation ref="figure"
                    text="A contour of a function of two variables, a point on that contour, and the gradient of the function at that point">
            <annotation ref="contour"
                        text="A contour of the function.  The value of the function at each point of the contour is four."/>
            <annotation ref="x0"
                        text="A point x naught on the contour"/>
            <annotation ref="gradient"
                        text="The gradient of the function at the point x naught is orthogonal to the contour">
                <annotation ref="grad-label"/>
            </annotation>
        </annotation>
    </annotations>
Ample evidence points to the fact that attention to accessibility results in a better experience for everyone. Annotated diagrams offer additional evidence. While the original motivation for this technology was to support visually impaired readers, one can easily imagine that explorable diagrams encourage all readers to read more actively and allow authors to call more specific attention to relationships that may otherwise be missed.
Annotations are explored using the diagcess Javascript library created by Volker Sorge.
Tactile diagrams
A tactile version of the diagram, such as that shown below, may be created from the same source and embossed on 11.5” x 11” paper.
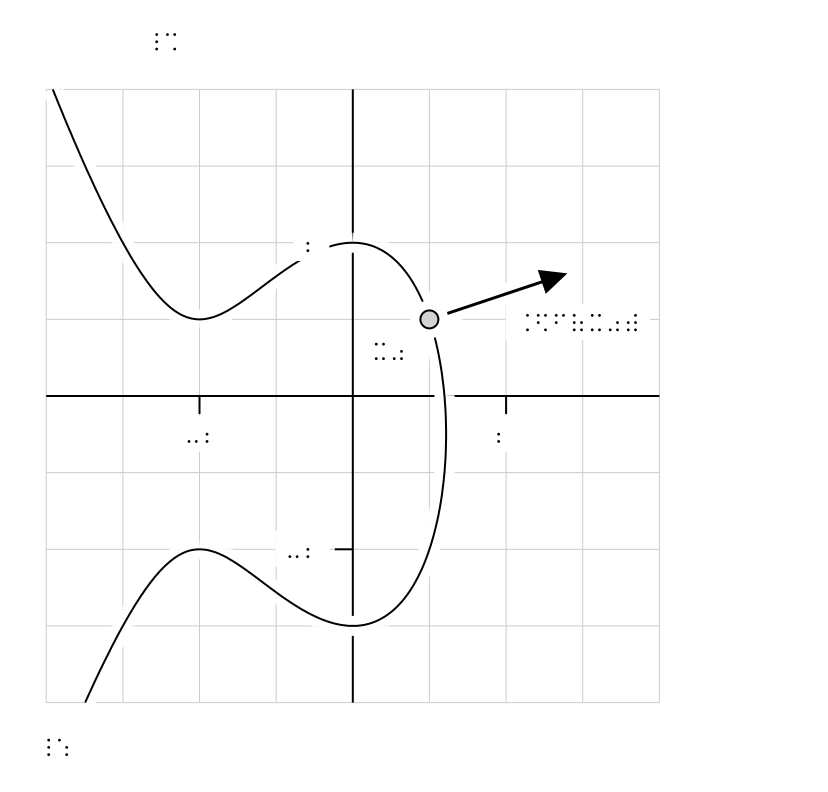
There are a few features to notice. The labels, of course, have been converted to braille. In addition, elements in the foreground, such as the contour, point, and vector, are surrounded by 1/8” of negative space. This feature is the result of feedback from tactile readers and is meant to prevent graphical components from colliding with one another and possibly resulting in confusion. More broadly, the tactile diagrams produced by PreFigure are designed to conform to conventions developed by the Braille Authority of North America.
While PreFigure is an independent project for authoring accessible diagrams, it is very much inspired by and shares the same design principles as PreTeXt. In fact, PreFigure originated at a workshop held at the National Federation of the Blind and organized to address the challenge of automating the production of tactile diagrams to accompany the conversion of PreTeXt documents into braille. PreFigure is now fully integrated into PreTeXt; one may include PreFigure source directly inside a PreTeXt document and have diagrams created in the appropriate format as part of the PreTeXt build process.
It is possible that an instructor preparing course materials will never need to create tactile versions of diagrams for their students. Nevertheless, I encourage all authors to inspect the tactile versions of their PreFigure diagrams since imagining a wider audience will lead to more careful design choices. For example, tactile diagrams will frequently appear more cluttered than a sighted version of the same diagram simply because of the way that space is allocated. This hopefully leads authors to reevaluate whether all the features they have included are necessary for communicating their essential ideas and whether some simplifications may be possible. In this way, again, consideration of a wider audience will improve the experience of everyone.
During my 27 years at Grand Valley State, I estimate that I’ve had over 3000 students in total. The incidence of blindness in the general population is estimated to be about 0.6%, which means it is reasonable that I should have had about 18 blind students during this time. However, like most of my colleagues, I have never had a blind student, and many speculate that the paucity of high-quality mathematical resources for visually impaired students is a contributing factor. With more attention given to accessibility issues, we can lay the groundwork for everyone to experience the joy of mathematical thinking.
Using PreFigure
While the PreFigure homepage provides users with documentation and other resources, perhaps the best way to get started creating diagrams is the PreFigure Playground, which was constructed by
Jason Seifken. In the spirit of a playground, users can quickly begin authoring diagrams and experimenting with different features. Notice the Visual/Tactile toggle that allows the author to switch between different views of the diagram. Annotations may also be added and explored in the playground.
At the top of the Playground are links to the PreFigure homepage as well as a set of sample diagrams and their source files that appear in the PreFigure documentation. Users may copy source from the documentation into the Playground and modify the diagrams as they wish.
While originally created as an environment for authors to begin writing diagrams, the Playground is also being used with a group of blind students in Hyderabad who are authoring and exploring their own diagrams. As a result of this work, one may notice, when no annotations are present in the source, that there is a default set of annotations that reads back the PreFigure source and highlights the resulting graphical components. It is hoped, more broadly, that this preliminary work will lead to more visually impaired authors creating their own diagrams.
While the Playground is a good place to start, it is not a fully functional PreFigure production environment as one cannnot create PDF or PNG versions of diagrams. There are a couple of options available, however. The PreFigure homepage links to instructions, which are also contained in the documentation, for installing PreFigure locally. Users wanting to avoid installing anything may also use a PreFigure codespace by following the instructions given at that site. Finally, since PreFigure is fully integrated into PreTeXt, users that are comfortable using either a PreTeXt codespace or the PreTeXt docker container already have a full PreFigure installation.
Please reach out with questions or suggestions!
Comments